


Marco Economics and Housing Market Trends
Have we hit the bottom in housing?
The US is 2.5 years into the “flat-cycle” in the housing market. We say flat-cycle instead of downcycle because what’s happened in housing hasn’t exactly been a market correction in the classic sense (20% drop in prices) the way 2009 was. However, after the 12-year run from 2010 to 2022 where housing saw steady growth culminating into the 20%+ year-over-year appreciation of 2021–2022, the 2023–2025 flat-cycle has felt like a real slog.
We want to tell the story of US housing in five charts looking over the last 30 years and focused on the last eight years. Home prices, inventory, days-on-market, homes sold, and cost of building materials all paint part of the picture.
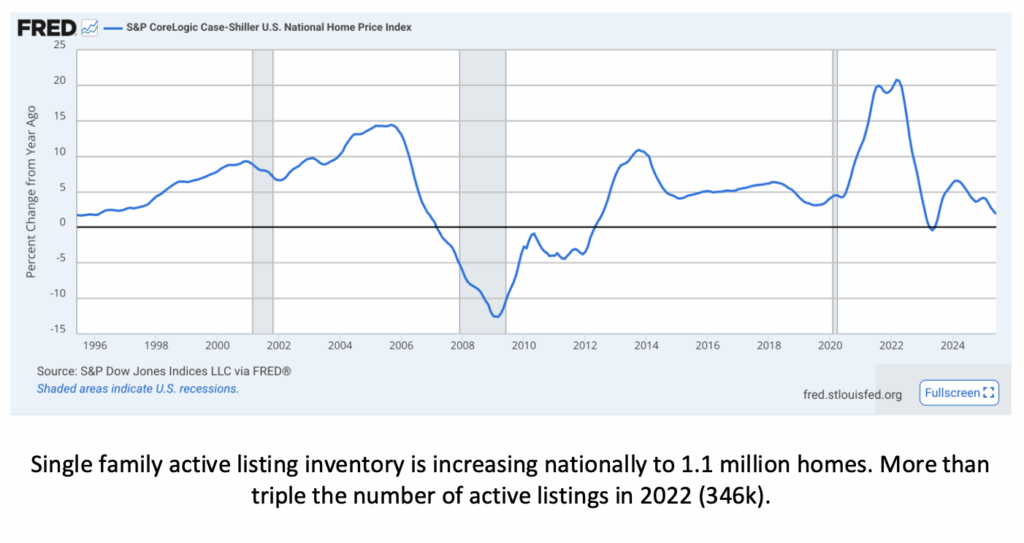
Home prices are increasing around 2% but slowing through 2025.
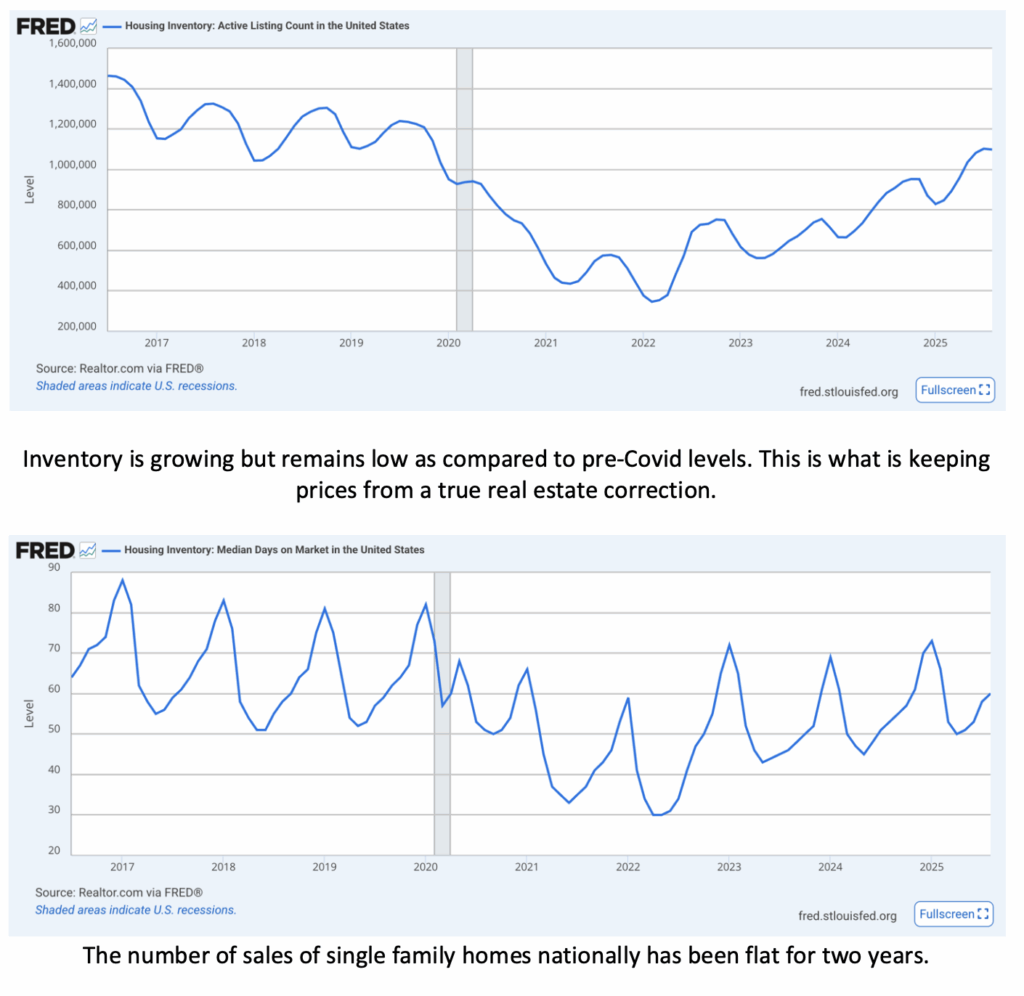
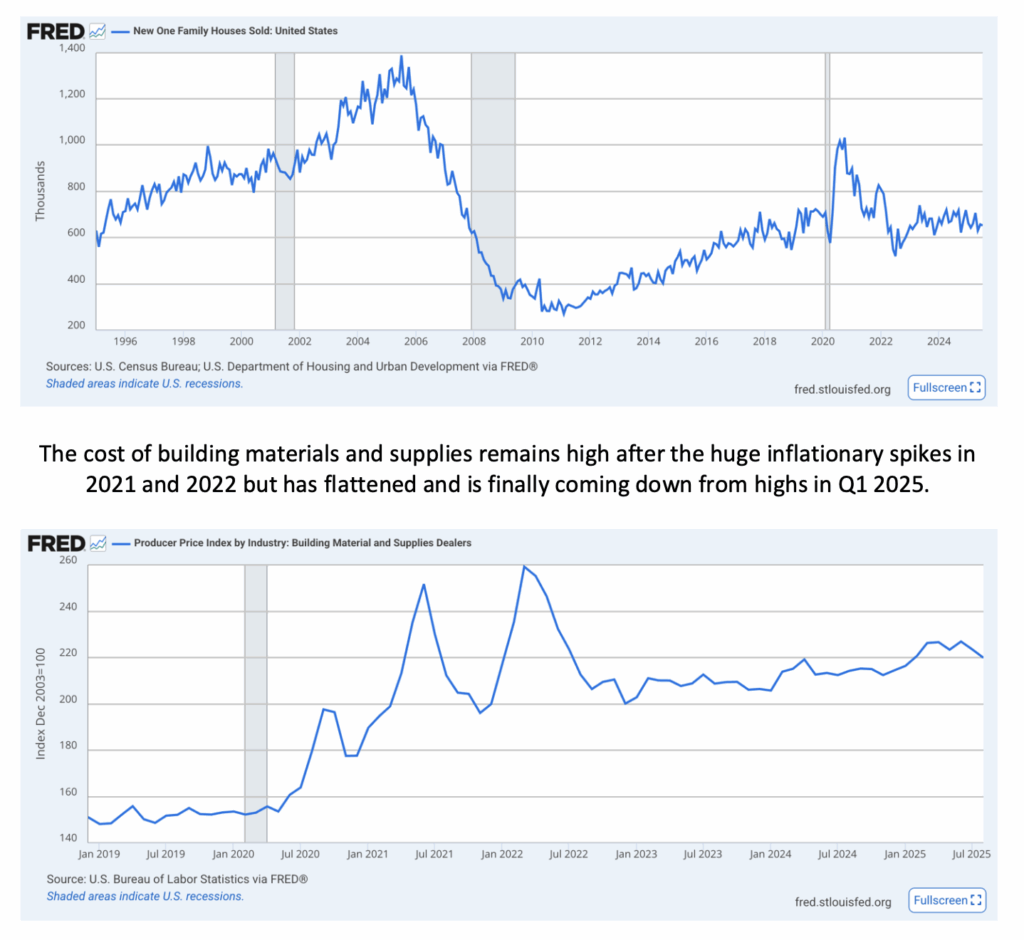
Putting all five of these charts together to paint the first part of the picture of the national housing market, we can see the slow deterioration of the housing market over the last 2.5 years, but never an outright correction. Prices are growing slowly, propped up by low inventory, but as inventory climbs and the number of sales stays flat, days on market climb and prices nudge down. Materials costs for construction remain high after the inflationary spikes but are starting to come down. The high cost of construction and the slow absorption rates keep pressure on profit margins for builders while the high prices combined with high mortgage interest rates have put relentless affordability pressure on buyers.
Over 80% of US mortgages are below a 6% interest rate, with 55% below 4%. Many homeowners have the golden handcuffs of their low fixed-rate mortgage. This is the main factor keeping inventory low — existing homeowners can’t sell their home and buy something comparable, so they are stuck in their homes with their low interest rate.
Household Formation
Household formation is one of the most important drivers in demand for homes nationally, and our product — small homes — benefits specifically. Household formation is the creation of a new separate household from existing households or from immigration. New households form from existing ones when, for example, an 18-year-old child moves out and gets an apartment to go to college or get a job. Often that household consists of two adult roommates sharing expenses. As the households age, they may each move out and rent their own apartment. Each of these events is household creation. Our small homes benefit from the demand created by household formation because when most households form, they are just one or two people — an individual, roommates, or a couple. Their needs for housing are met best with a small home because it fits their household size and tends to be less expensive.
Today we are seeing a lot of pent-up demand to form households. In 2020–2022, 2.75 million new households were formed. In 2023–2024, only 1.01 million new households were formed. That is like pressure building behind a dam. Let’s assume that in 2023 and 2024 there were 2.75 million households that wanted to form, but only 1 million of those could actually “move out of their parents’ house,” so to speak. That means there are 1.75 million people who want to form a new household but cannot, with the most likely reason being affordability or financial reasons. One can see the inflection in the data below after 2022 where interest rates put a ceiling on household formation. At some point, the dam is breached — or more likely, each time interest rates notch down 25 basis points, another cohort of buyers are “released” into the market and are going to, in turn, put upward pressure on prices.
Interest Rates
Interest rates have stayed higher for longer than many expected and have maintained very firm pressure on buyers as they struggle with affordability. Last week, Fed Chairman Powell announced a 0.25% interest rate cut bringing the Fed Funds rate to 4–4.25%. By press conference time on September 17th, the markets had a 95% expectation of a 0.25% rate cut, and most bond rates, including mortgages, had already factored in the rate cut in the week or two prior to the announcement — we saw rates drop in the first half of September helping to relieve the pressure on buyers. In just the few days since the rate cut announcement, we are already noticing a very positive psychological sentiment that “things are going to get better.”
The rate cut itself was largely based on deteriorating labor market data that has come out of the past two weeks including:
- August job creation was only 22,000 when the expectation was 40,000–100,000
- June job creation was revised down to a negative number, -13,000 jobs
- March 2024–March 2025 jobs revision was published revising the number of jobs created during that 12-month period down by 911,000
In total, nearly every jobs report for the last three years has been revised down after initial publishing of the data — a total of 2 million fewer jobs were created than had been originally published.
- A new Fed governor was sworn in last week, Stephen Miran, a Trump appointee after a recent resignation. He was the sole member voting for a 50 bps rate cut. This is important because the Trump administration is likely to have the opportunity to appoint a few additional governors over the next year, and of course, Chairman Powell’s term is up in May 2026. Trump has been vocal about replacing him with someone that has a more aggressive stance on rate cutting.
- The Dot Plots — charts released that show each Governor’s rate forecast over the next few years — showed better odds around two additional rate cuts in 2025 (vs. one rate cut by year-end). This small surprise caused some immediate movement in bonds.
Overall, mortgage rates are slowly creeping down with a current 30-year fixed around 6.1% — good news, but basically exactly where mortgage rates were one year ago in September 2024 (6.09% on 9/29/2024). It’s an improvement from the 7% rates that peaked in early 2025, though. Viscerally, we feel like once 30-year fixed mortgage rates get solidly below 6%, we’ll see less affordability strain. The difference between 7% and 6.1% on, for example, one of our Hiatus Ninth Twinhomes at $865,000 is over $400/month. For buyers on the edge of affordability, a $400/month delta in payment might make the difference. Put differently, that 90bps drop in rates means a buyer making $15,000 less per year in income can qualify.
Calling the Bottom
We believe the housing market has generally bottomed in terms of prices and (low) transaction volume, and the market is going to start to unlock slowly and gain momentum over the next year. And while we won’t pretend that the media has a strong track record of “calling the bottom,” we have started to find a general consensus of expectations that the market is going to improve. Psychology is such an important factor in buyer behavior that as people believe the housing market is rebounding, it is likely to gain momentum.
We found the following articles informative with some very interesting charts and data points:
Take the Long Way: Is Housing Bottoming?
It Looks Like the Housing Market May Be Bottoming Out
We are living in an ironic version of macroeconomic game theory where any “bad” economic news is actually good news because it makes rate cuts more likely. Sadly, we felt positive about the deterioration in the labor markets because it means there was more pressure on the Fed to cut rates. And “good” economic news is bad news because it makes tight monetary policy more likely. This is the inevitable result of a central bank that has been tinkering with the market so long that market participants depend more on the central bank’s decisions than they do on the underlying market fundamentals. In fact, consider what happened in 2020 with the Fed’s response to Covid: Covid hit and society shut down, massive layoffs, huge decreases in spending because everything was closed — summarizing to say Covid ushered in terrible underlying economic fundamentals. The Fed responded by slashing rates by 1.5% and re-engaging in Quantitative Easing (QE) by buying $200 billion in mortgage-backed securities over the spring of 2020.
All this liquidity and cheap financing resulted in a huge two-year real estate boom (20% year-over-year price increases for two years). Of course, it also fueled the inflation we are dealing with now. However, the illustration here is to say that the only thing that is going to break the slow unfreezing of the real estate market is catastrophic economic data that causes drastic monetary loosening by the Fed. Otherwise, we’re in a grind-it-out scenario that is going to slowly improve over the next 1–2 years.


https://shorturl.fm/XFiY4